📌 Ethereum Price Forecast: ETH Failed to Break Through the $2,800 LevelWhat Levels Are Relevant Right Now?
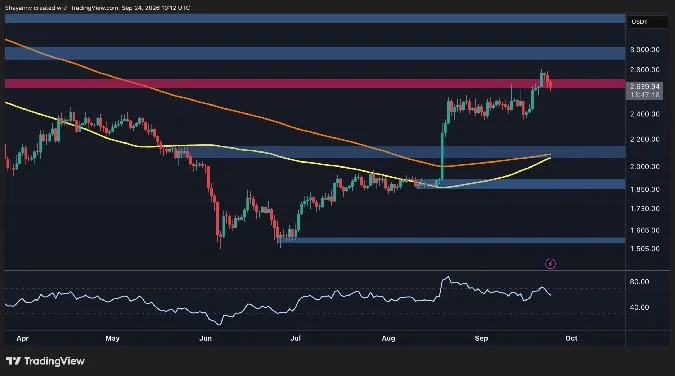
– The daily chart shows a clear structural improvement relative to the June low, which was recorded at around $1,500.
After that, ETH formed higher local lows and broke out of the $2,000$2,100 range thanks to an acceleration in the uptrend in August. The final stage proved to be the most pronounced structural shift, but it was followed by consolidation in September, which became a key reference point for the current trend.
Recently, ETH rose to the $2,800 mark, after which a downward reversal occurred. Currently, the price is around $2,640, within the specified resistance zone of $2,600$2,700. A firm daily close above this range will reinforce the breakout pattern and make the area near $3,000 the next immediate barrier.
On the downside, the first significant support is located roughly in the same consolidation zonethe $2,400$2,500 range. However, a deeper correction could push ETH down to support near $2,100, where the 100-day and 200-day moving averages also converge, forming a potential bullish cross. This makes the specified area critically important for the market to hold in order to avoid another downward move.
The four-hour chart provides a clearer picture of the recent consolidation and pullback. ETH rose from around $2,400 and broke sharply higher, reaching the $2,800 zone. However, several subsequent candlesticks failed to hold these highs, triggering a pullback to the $2,600 resistance level.
Thus, the immediate battle will be centered precisely in the $2,600$2,700 range. ETH is currently trading near the lower boundary of this zone after pulling back from around $2,800. A recovery above $2,700 will once again draw attention to the recent short-term highs near $2,800. , “detected_source_language “: “EN
On the other hand, a continued pullback from the current area could lead ETH toward the bullish order block around $2,450. This is the main short-term resistance zone on the chart. A break below this level would weaken the short-term bullish structure and could pave the way to the next order block near $2,250.
“”,”detected_source_language”:”RU
The 4-hour RSI has also deteriorated significantly from recent overbought levels and has fallen below the 50 mark. This suggests a loss of short-term momentum rather than a confirmed reversal of the broader trend. Nevertheless, for the bullish structure to remain intact, ETH should ideally consolidate above the $2,500 level.
The exchange supply ratio reflects the proportion of Ethereums circulating supply held on exchanges. A decline in this indicator typically signals that a smaller portion of the available ETH supply is held on exchanges, while an increase indicates a rise in the volume of ETH held in exchange wallets.
The chart shows a noticeable decline in Ethereums exchange supply ratio over the past few years. The metric has decreased from approximately 0.18 at the beginning of 2025 to about 0.123 currently, despite the fact that the ETH price has recovered above the $2,500 level.
This latest shift is particularly significant, as the exchange supply ratio continues to hover near the lows shown in the chart, while the price of ETH has recently accelerated its upward trend. This suggests that the volume of ETH on exchanges relative to the total supply has continued to decline amid the broader market recovery.
From a market structure perspective, a consistently low exchange supply ratio may indicate that less ETH is available on exchanges for potential sale. However, this indicator alone does not guarantee a rise in prices, and the current price level around $2,800 confirms that resistance remains significant and that any reduction in supply must be accompanied by sufficient demand to ensure a further recovery.
“,”detected_source_language”:”RU







 Bitcoin
 Ethereum
 Tether
 BNB
 XRP
 USDC
 Solana
 TRON
 Figure Heloc
 Zcash